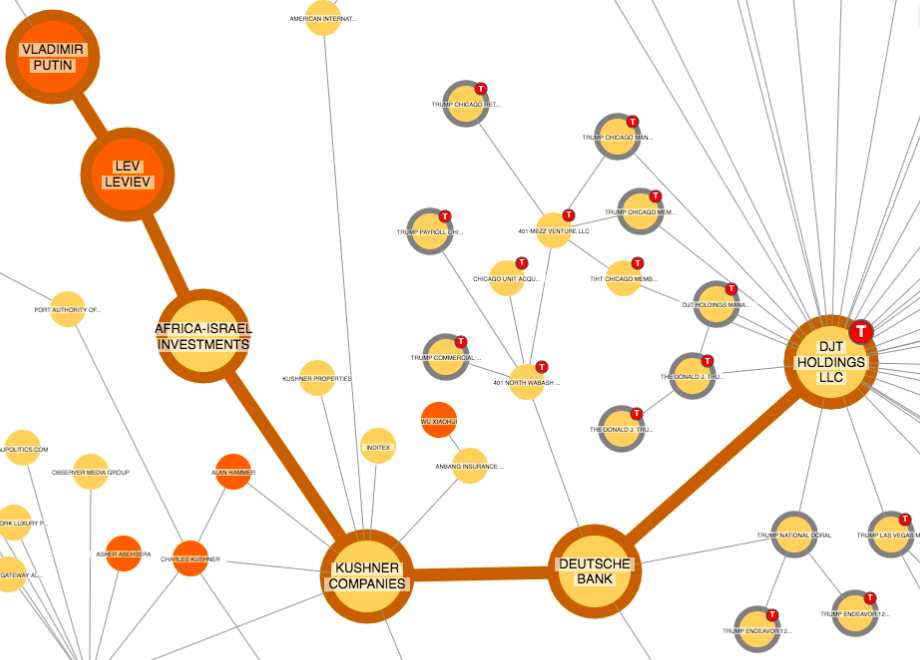
Visualizing the business and personal connections of Donald Trump
This was an eye-opening 1 hour talk about graph modeling concepts and engaging graph visualization using KeyLines models developed by Cambridge Intelligence.
Before coming to this event, I had no idea at all about nodes and links, and network/graph visualizations. I have used similar visualization concepts in use case diagrams or for simple hand-drawn visualizations of previous class concepts. But I have never thought of using nodes and links to visualize connections between people, systems, places, etc. I was amazed at the extensive applications and use cases that graph modeling has.
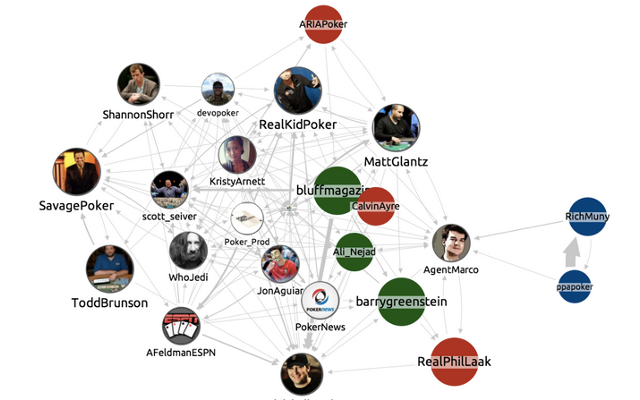
KeyLines Social Network Visualization – A screenshot of an interactive Twitter network, created in KeyLines, featuring Poker experts filtered by their Betweenness value and sized by Klout score
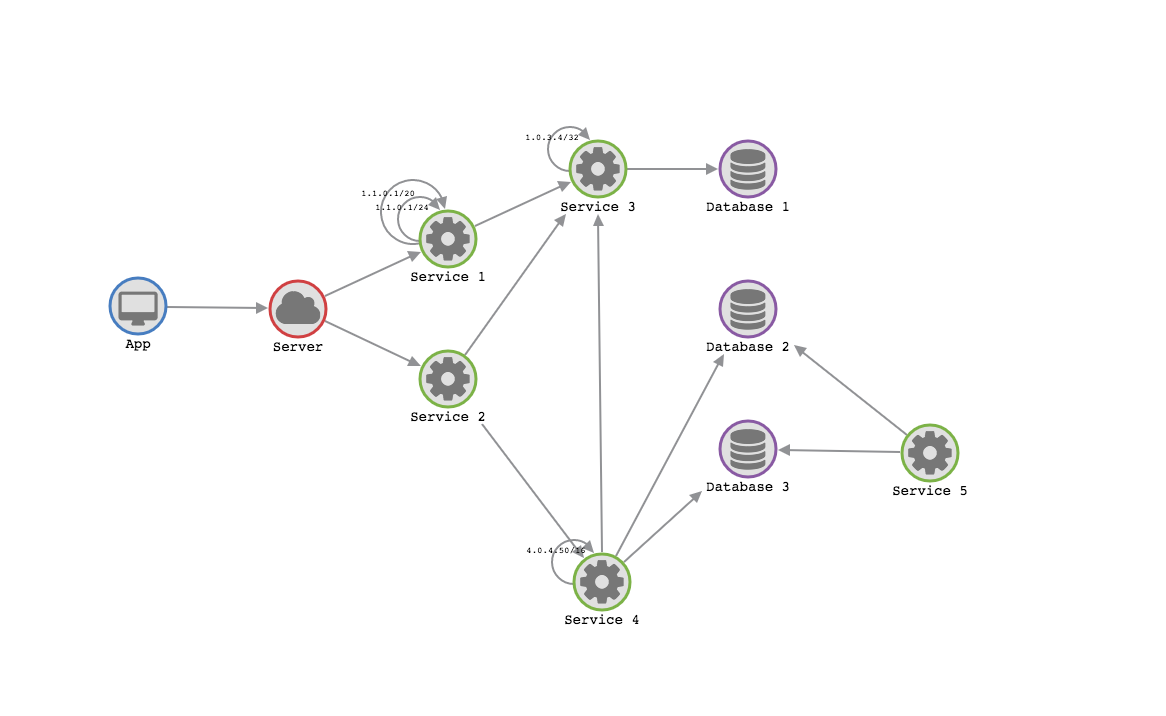
KeyLines Visualizing IT infrastructure –
Network visualization can provide analysts with an interactive and intutive view of network connectedness and activity.
I am not knowledge enough about this discipline to discuss anything further. I will definitely study these models more and give you updates later.
